UNDERSTANDING YOUR COMPANY
 Before establishing
reduction targets or developing an implementation programme, it is important to understand
your company's air emissions and energy consumption. This Section provides guidance and
references on how to evaluate their company's air emissions and energy consumption and how
to conduct an initial audit of operations. Before establishing
reduction targets or developing an implementation programme, it is important to understand
your company's air emissions and energy consumption. This Section provides guidance and
references on how to evaluate their company's air emissions and energy consumption and how
to conduct an initial audit of operations.
Quantifying Your Energy
Consumption
Saving energy reduces air emissions. Electricity and fuel consumption
can be used to quantify energy consumption. This information can be gathered from your
utility and fuels bills. If this information is not routinely kept, establishing a system
to do so is an important first step in quantifying your energy consumption.
1 unit of electricity consumed is equal to 1 kilowatt hour (kWh) and
1 unit of gas consumed is equal to 48 megajoules (MJ) for Towngas or 46 MJ for liquefied
petroleum gas (LPG). These conversion factors are useful for quantifying energy
consumption on a common basis across different sectors and estimating corresponding direct
and indirect air emissions.
Quantifying Your Air Emissions
 Industrial
operations, vehicles and power plants are the main "direct" air pollution
sources in the PRD region. Offices are also an "indirect" air pollution source
as the electricity consumed by these operations results in air emissions from power
plants. Industrial
operations, vehicles and power plants are the main "direct" air pollution
sources in the PRD region. Offices are also an "indirect" air pollution source
as the electricity consumed by these operations results in air emissions from power
plants.
Sulphur dioxide (SO2), nitrogen oxides (NOx),
particulate matter (PM) and volatile organic compounds (VOCs) are key air pollutants in
the PRD region. The Hong Kong Special Administrative Region Government (the HKSAR
Government) and the Guangdong Provincial Government reached a consensus in April 2002 to
reduce emissions of SO2, NOx, PM and VOCs by 40%, 20%, 55% and 55%,
respectively, by 2010, using the emissions levels at 1997 as a base. Therefore, this
sections focuses on quantifying SO2, NOx, PM and VOCs emissions.
Selective key air pollutant emissions sources are summarized
below.
| Emissions Sources |
Air Pollutants |
Sulphur
Dioxide(SO2) |
Nitrogen
Oxides(NOx) |
Particulate
Matter(PM) |
Volatile Organic
Compounds(VOCs) |
Fuel Consumption |
|
|
|
|
 Coal and
Oil-fired Power plants Coal and
Oil-fired Power plants |

|
|
|
|
| Diesel
oil-fired Generators, Boilers and Furnaces |
|
|
|
|
Vehicles |
|
|
|
|
| Motor
vehicles |
|
|
|
|
| Marine
vessels |
|
|
|
|
| Petrol
filling stations |
|
|
|
|
| Emissions Sources |
Air Pollutants |
Sulphur
Dioxide(SO2) |
Nitrogen
Oxides(NOx) |
Particulate
Matter(PM) |
Volatile Organic
Compounds(VOCs) |
Typical Manufacturing Industries (emissions from processes) (a) |
|
|
|
|
| Cement |
|
|
|
|
| Chemical |
|
|
|
|
| Construction |
|
|
|
|
| Electronics |
|
|
|
|
| Plastics |
|
|
|
|
| Printing |
|
|
|
|
| Textiles |
|
|
|
|
| Toys |
|
|
|
|
Indirect Source |
|
|
|
|
| Office |
(c)
|
(c)
|
(c)(d)
|
(e)
|
Notes:
(a) Many different industries operate in HK and the PRD region, these are just some of the
more common industry sectors.
(b) Motor vehicle fuel sold in Hong Kong has a low sulphur content. Much of the diesel
sold on the Mainland does not.
(c) NOx and SO2 emissions are generated from energy consumed in
offices.
(d) PM emissions in offices also include dusts from ventilation systems, paper,
photocopiers, printers, etc.
(e) VOCs in offices come from cleaning agents, chemical usage, paints, furnishing, etc.
Emissions Estimated from Energy Consumption
Electricity, towngas or liquefied petroleum gas (LPG) are the common
sources of energy used in Hong Kong. "Indirect" air emissions from offices can
be estimated by considering the quantity of electricity consumed, as identified from
monthly electricity bills, and using typical emissions factors.
Electricity
Nitrogen oxides (NOx), sulphur dioxide (SO2)
and particulate matter (PM) are the major air pollutants generated from power stations. A
reduction in electricity used will reduce air emissions from power stations. To estimate
indirect emissions from electricity usage in Hong Kong the following equations can be
used.
EMISSIONS ESTIMATION FROM USE OF
HONG KONG ELECTRICITY
NOx = electricity used (no. of units**) x 1.3 (g/kWh)
SO2 = electricity used (no. of units**) x 2.1 (g/kWh)
PM = electricity used (no. of units**) x 0.1 (g/kWh)
** 1 unit (in the electricity bill) = 1 kWh
Reference to CLP Social and Environmental Report 2005 and HEC Environment, Quality, Health and
Safety Report 2005 |
|
EXAMPLE OF EMISSIONS ESTIMATIONE
missions estimation from electricity bill from the office of "ABC" in Hong Kong.
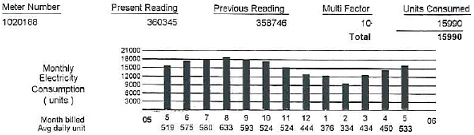
NOx = 15,990 x 1.3 (g/kWh) = 21 kg
SO2 = 15,990 x 2.1 (g/kWh) = 34 kg
PM = 15,990 x 0.1 (g/kWh) = 1.6 kg
** 1 unit (in the electricity bill) = 1 kWh
Reference to CLP Social and Environmental Report 2005 and HEC Environment, Quality, Health and
Safety Report 2005 |
|
EMISSIONS ESTIMATION FROM GASEOUS
FUEL CONSUMPTION
NOx = no. of unit x 48 (MJ) x 8.92 (kg/106 MJ of gas) [Towngas]
NOx = no. of unit x 46 (MJ) x 8.92 (kg/106 MJ of gas) [LPG]
Reference to Towngas Environment, Quality, Health and Safety Report 2005 |
|
Emissions Estimated from Vehicle Movement / Idling
 NOx and PM
are the main air pollutants generated from vehicle movements on roads and idling.
Different sizes and types of vehicle engines produce different levels of air pollutants.
Estimating air emissions from vehicle fleets is complex and would require more detailed
information on the vehicle type, engine condition, fuel used, running pattern, and etc. To
provide a simple way, total distance travelled and idling time can be used to conduct
rough estimations of vehicle emissions. NOx and PM
are the main air pollutants generated from vehicle movements on roads and idling.
Different sizes and types of vehicle engines produce different levels of air pollutants.
Estimating air emissions from vehicle fleets is complex and would require more detailed
information on the vehicle type, engine condition, fuel used, running pattern, and etc. To
provide a simple way, total distance travelled and idling time can be used to conduct
rough estimations of vehicle emissions.
The HKSAR Environmental Protection Department (EPD) has
developed a comprehensive EMFAC model to estimate vehicle emissions. Further information
on the EMFAC model can be found at EPD's Website.
(www.epd.gov.hk/epd/english/environmentinhk/air/guide_ref/emfac.html).
EMISSIONS ESTIMATION FROM VEHICLE
MOVEMENT / IDLING
While Travelling
Air Emissions = [kilometres travelled] x [average emissions for different vehicle type (g/km)]
| Air Pollutant |
NOx |
PM |
| Average Fleet Vehicle Emissions (g/km travelled) |
|
|
| Passenger car |
0.9 |
0 |
| Light Goods Vehicles |
1.6 |
0.3 |
| Heavy Goods Vehicle |
8.2 |
0.6 |
Reference to Energy Consumption Indicators (HKSAR Electrical and Mechanical
Services Department), Traffic Census 2005 (HKSAR Transport Department), and Emissions
Inventory Guidebook 2005 (European Environment Agency)
Example:
A light goods vehicle running 20 km a day,
NOx emissions = 20 x 1.6 = 32 g ; PM emissions = 20 x 0.3 = 6 g
While Idling
Air Emissions = [Idling time (min)] x [average emissions for different vehicle type (g/min)]
| Air Pollutant |
NOx |
PM |
| Average Emissions (g/min of idling) |
|
|
| Passenger car |
0.2 |
Negligible |
| Public Light Bus / Passenger Van /Light Goods Vehicles |
0.5 |
0.05 |
| Heavy Goods Vehicle / Non-franchised / Franchised Bus |
2.0 |
0.05 |
Example:
A heavy goods vehicle idling to unload goods for 10 minutes,
NOx emissions = 10 min x 2.0 g/min = 20 g ; PM emissions = 10 min x 0.05 g/min = 0.5 g |
|
Emissions Estimation from Industrial Operations
 Power plants
and industrial operations contribute to the local air pollution problem in Hong Kong and
the PRD. Industrial processes produce a variety of different air pollutants and back-up
diesel generators also contribute. Power plants
and industrial operations contribute to the local air pollution problem in Hong Kong and
the PRD. Industrial processes produce a variety of different air pollutants and back-up
diesel generators also contribute.
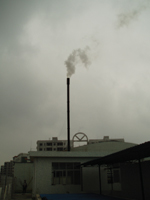
Emissions from Power Plants in PRD Region
Emissions from power plant operating in Hong Kong have been discussed
in the above section. In the PRD region, there are a large number of government and
privately owned power plants operating. As noted above, NOx, SO2 and
PM are the main air pollutants from these power plants.
In China, power plants are mostly coal-fired. The emissions levels of
SO2 from power plants depend in part on the sulphur content of the
coal used as well as the nature and type of emissions controls installed, which can vary
significantly between power plants. The following equations can be used to estimate
pollutant emissions from electricity consumed in the PRD.
EMISSIONS ESTIMATION FROM
ELECTRICITY IN MAINLAND CHINA
NOx = electricity used (kWh) x 1.4 (g/kWh)
SO2 = electricity used (kWh) x 2.1 (g/kWh)
PM = electricity used (kWh) x 0.2 (g/kWh)
Reference to Study of Air Quality in the Pearl River Delta Region,
Environmental Protection Department |
|
Emissions from Diesel Backup Generators
Diesel generators are usually used as backup for power
generation in manufacturing industries. Air pollutants will be generated from the
combustion of diesel oil and NOx is the main air pollutant. The emissions of NOx can be
estimated based on the installed capacity of the generator and an emissions factor. The
following simplified formula could be useful for estimating NOx emissions.
EMISSIONS ESTIMATION FROM DIESEL
BACKUP GENERATOR
NOx = installed generator capacity (hp) x 0.014 (kg/hp-hr)
x operating hour (hr)
Source : Compilation of Air Pollutant Emissions Factors, AP-42, 5th Edition |
|
Emissions from Diesel Boiler
Diesel boilers are usually used to provide heat and steam for
the manufacturing processes such as dyeing. NOx and SO2 are the main
air pollutants generated from the combustion of diesel oil. The emissions of NOx and SO2 can be estimated based on the diesel oil consumption, sulphur content in
diesel oil and the well-established emissions factors. The following simplified formula
could be useful for estimating NOx and SO2 emissions.
EMISSIONS ESTIMATION FROM DIESEL
BOILER
If power rating < 293 kW
NOx = diesel oil consumption (litre) x 2.2 g/litre
SO2 = diesel oil consumption (litre) x 17 g/litre x sulphur content in
diesel oil (%)
Source : Compilation of Air Pollutant Emissions Factors, AP-42, 5th Edition |
|
Emissions from Industrial Process
 Different
types of industrial processes will produce different types of air emissions. The US EPA
developed a Compilation of Air Pollutant Emissions Factors, AP-42, 5th Edition (AP-42) in
1995 which is a comprehensive guidebook to assist facility operators to understand: Different
types of industrial processes will produce different types of air emissions. The US EPA
developed a Compilation of Air Pollutant Emissions Factors, AP-42, 5th Edition (AP-42) in
1995 which is a comprehensive guidebook to assist facility operators to understand:
- The types of air pollutants generated by specific activities;
- Methodologies for estimating emissions factors; and
- Suitable air pollution control measures and associated removal
efficiencies.
The AP-42 covers a number of industrial activities including:
- External combustion sources such as boilers;
- Solid waste disposal such as landfill;
- Stationary internal combustion sources such as gas turbine engines;
- Evaporation loss sources;
- Petroleum industry;
- Organic chemical process industries;
- Liquid storage tanks;
- Inorganic chemical industries;
- Food and agricultural industries;
- Wood products industries;
- Mineral products industries such as concrete batching and stone
crushing;
- Metallurgical industries such as aluminium manufacturing.
For further details: www.epa.gov/ttn/chief/ap42/
Volatile Organic Compounds (VOCs) Estimation
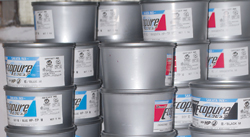 VOCs are a family of
chemical compounds that possess high vapour pressure and low water solubility. Many VOCs
are human-made and are used in the manufacturing of paints, inks, adhesives,
pharmaceuticals and refrigerants. VOCs are a family of
chemical compounds that possess high vapour pressure and low water solubility. Many VOCs
are human-made and are used in the manufacturing of paints, inks, adhesives,
pharmaceuticals and refrigerants.
A "Joint Study on Pearl River Delta Region Air Quality"
completed in 2002 identified paints, the printing industry, VOC-containing consumer
products and motor vehicles to be the major VOC emissions sources in the PRD. VOCs are
mainly emitted from the solvent evaporation and the level of VOC emissions depends on the
composition of the products and solvent. For example, VOC emissions will be higher from
solvent-based paint or printing inks than their water-based equivalents.
The HKSAR Government proposed in late 2004 a scheme to require
mandatory registration and labelling of the VOCs in paints, printing inks and selected
consumer products for sale in Hong Kong. However after extensive consultation, the
Government has amended the initial proposal to be a more direct and effective control
scheme.
In the 2006 Policy Address on 11 October 2006 the HKSAR Chief
Executive, Mr Donald Tsang, announced that legislation to restrict the VOC content of
printing materials, paints and consumer products will be introduced, based on stringent US
and California standards. The new regulation will impose maximum limits on the VOC content
of selected products in phases from 1 April 2007. This will enhance significant reduction
of VOC emissions. During the transitional periods, paints not complying with the future
VOC limits will be required to carry a bilingual advisory label.

Conducting Initial Audit
Before defining the EEM objective and establishing the reduction
target, you should know the current position of your company, i.e., how much energy is
consumed and how many emissions are produced by your operation. Carrying out an initial
energy and emissions audit is essential to gather the background data of the company.
The types of data to be gathered should include:
| General Information |
- No. of staff;
- Working hours; and
- Floor area.
|
| Information related to air emissions |
- Number of operating stacks
- Types of fuel used (i.e., diesel, natural gas, LPG, etc)
- Monthly fuel consumption rate (litre/month or m3/month)
- Operating hours of each stack
- Any air control measures (i.e., air filter, wet scrubber, cyclone, activated carbon, etc)
|
| Information related to energy consumption |
- Number and types of office equipment (i.e., printers, computers, photocopiers, fax
machines, etc)
- Power rating of industrial equipment (kilowatts, horsepower, etc)
- Operating hours of each equipment
- Type and number of fluorescent tubes / light bulbs
- Electricity bills for the past twelve months
- Gas bills for the past twelve months
- Number of air conditioning units
- What type of air conditioning system (i.e., window-mounted type, split type, water-cooling
tower, etc)
|
| Information related to vehicular emissions |
- Total number of company cars and trucks by type and size of vehicle
- Total kilometres travelled by cars and trucks by type and size of vehicle
|
The gathered data can be used to estimate the energy consumption and
air emissions based on the equations and references presented above. In addition, the
benchmarking system of the HKSAR Electrical and Mechanical Services Department (EMSD), as
described in the next Section, also provides guidance on how to estimate energy
consumption.
The initial audit should be carried out by the EEM Team. The
gathered data should be recorded and kept on file to enable tracking of performance. A
sample template for undertaking an initial audit can be found in Appendix A.
Energy Audit - An Effective
Energy Management Tool
 "To many SMEs,
energy audit sounds like a technical term, but it is simply an examination of energy consuming
systems and housekeeping practices to ensure that energy is being used efficiently," Mr
Eddie Wu, Energy Services Manager of CLP Power Hong Kong said. "You can always find room
for improving energy efficiency. Just walk around your office or premises and perform a site
survey following the Energy Audit Guidelines, which is available from various sources such as
the Government's Website." "To many SMEs,
energy audit sounds like a technical term, but it is simply an examination of energy consuming
systems and housekeeping practices to ensure that energy is being used efficiently," Mr
Eddie Wu, Energy Services Manager of CLP Power Hong Kong said. "You can always find room
for improving energy efficiency. Just walk around your office or premises and perform a site
survey following the Energy Audit Guidelines, which is available from various sources such as
the Government's Website."
Since 1999, CLP has dedicated an Energy Services Team to conduct energy
audits for more than 500 large commercial and industrial customers, helping them increase
energy efficiency and achieve tangible energy savings. Amongst them is a large property
management company which manages many office towers, hotels, service apartments and shopping
arcades, a case illustrated by Mr Wu.
"On lighting and hot water supplies, a customer installed over
20,000 electronic ballasts, phased out several aging gas or diesel boilers and switched to the
highly energy efficient and emissions-free heat pump water heating systems. On power supply,
capacitor banks have been installed to improve the power factor. On air-conditioning, the
customer was advised to use fresh water cooling towers for chiller heat rejection. Total
energy savings from all these initiatives is as high as 5 GWh a year."
An energy audit is similar to financial accounting. It is a quick way to
assess and analyze energy performance, identify obvious energy wastage and opportunities for
energy savings that help reduce emissions.
"Through auditing, customers are made aware of their potential areas
of energy inefficiency," Mr Wu continued to explain. "During the visits to
customers' premises, we gave various advice to clients, ranging from housekeeping management
to installation of energy-efficient equipment. Our experience shows that through an energy
audit most users can identify the potential to save 5-10% on overall energy costs."
Many energy saving practices are just simple steps. For example,
replacing T12 or T10 fluorescent tubes with T8 or T5 energy efficient fluorescent tubes can
improve energy efficiency by 10% to 30%. Using LCD monitors can save more than 50% off
electricity usage compared to CRT monitors. Regular cleaning of condenser tubes, cooling coils
and air filters can help maintain cooling efficiency. Purchasing energy efficient equipment
can reduce the level of energy consumption, etc.
CLP Power has actively contributed to raising energy saving and
environmental awareness through various programmes such as energy audits, community-based
education programmes and regular seminars/conferences to exchange international and local
energy practices with SMEs. |
|
 Download this Chapter (In PDF Format) Download this Chapter (In PDF Format)
|